5.5. Imprecision
GRADE suggests that examination of 95% confidence intervals (CIs) provides the optimal primary approach to decisions regarding imprecision. Results are considered imprecise when studies include relatively few patients and few events and thus have wide confidence intervals around the estimate of the effect. In this case a guideline panel will judge the quality of the evidence lower than it otherwise would because of resulting uncertainty in the results.
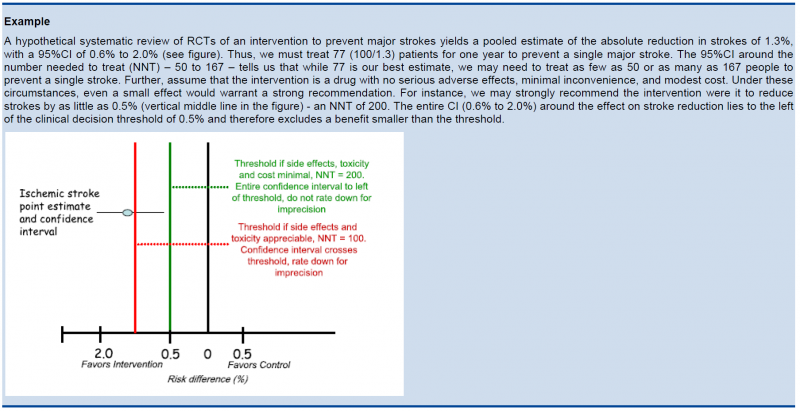
As a general principle GRADE recommends to consider the rating down for imprecision If a recommendation or clinical course of action would differ if the upper versus the lower boundary of the CI represented the truth. In order to judge this the clinical decision threshold needs to be defined. We explain the situation for both categorical and continuous outcomes.
5.5.1. Clinical decision threshold and minimally important difference
5.5.1.1. Categorical outcomes
As we explained before, it is good to discuss the clinical decision threshold and try to determine them on beforehand. However, one must be careful not to apply this in a too mechanical way, as you need also to take into account the downsides of the intervention, such as side effect or morbidity induced by the intervention, on which in a lot of cases you have only information after collecting the evidence. If it is not possible to determine a threshold, then GRADE suggests to use a RRR or RRI greater than 25%. This 25% threshold is a good and pragmatic starting point, but other factors should be taken into account as well, such as the absolute risk reduction.
5.5.1.2. Continuous outcomes
If the 95%CI upper or lower CI crosses the minimally important difference (MID), either for benefit of harm.
Note: if the MID is not known or the use of different outcome measures required calculation of an effect size, we suggest downgrading if the upper or lower CI crosses an effect size of 0.5 in either direction.
Effect size (ES):
A generic term for the estimate of effect of treatment for a study. Sometimes, the term is used to refer to the standardized mean difference, the difference between two estimated means divided by an estimate of the standard deviation.
To facilitate the understanding we suggest an interpretation of the effect size offered by Cohen, also known as ‘Cohen’s d’[1]. According to this interpretation, an effect size or SMD of around:
- 0.2 is considered a small effect;
- 0.5 is considered a moderate effect;
- 0.8 or higher is considered a large effect.
There are also other methods to standardise effect sizes, such as Glass ∆ or hedges d, depending on the choice of the estimator of the standard deviation.
[1] (Cohen J. Statistical Power Analysis for the Behavioral Sciences. 2nd ed; 1988).
5.5.2. Application and examples
The concrete application of these rules differs according to the situation. Note that imprecision is judged on all outcomes that are judged critical, so the precision of the estimations of the effects on both harms and benefits need to be evaluated.
- Studies indicate a benefit compared to the alternative so you consider recommending the intervention based on the fact that it is beneficial in a clinically significant way.
In this case you must prove not only that the pooled or best estimate of the effect is different from no effect but that it is better than the clinical decision threshold. So the confidence interval must exclude this threshold.
- Studies indicate a harm compared to the alternative so you consider not recommending the intervention based on the fact that it is harmful in a clinically significant way.
In this case you must prove not only that the pooled or best estimate of the effect is different from no effect but that it is more harmful then the clinical decision threshold. So the confidence interval must exclude this threshold.
- Studies indicate that it is not better than the alternative so you consider not recommending the intervention based on the fact that it is not better in a clinically significant way.
In this case you must prove that the pooled or best estimate of the effect is lower that the clinical decision threshold. So the confidence interval must exclude this threshold.
- Studies indicate that it is not more harmful than the alternative so you consider recommending the intervention based on the fact that it is not more harmful in a clinically significant way.
In this case you must prove that the pooled or best estimate of the effect is lower that the clinical decision threshold. So the confidence interval must exclude this threshold.
The last two situations amount to proving non superiority or non inferiority. If the line of no effect is crossed, this does not play a major role in the decision.

5.5.3. Relative versus absolute reductions
The recommended output of a meta-analysis is a relative risk or odds ratio as they are more stable across different baseline risks, but absolute reductions are more useful for clinical decisions. The valid way of estimating the absolute risk reduction is to multiply the relative risk from the meta-analysis with the most plausible estimate or range of estimates of the baseline risk, this is the risk in the assumed control group, often called the assumed control risk.
Assumed control risk (ACR):
As relative risks are more stable, absolute risk reductions are best calculated applying a relative risk reduction to an assumed control risk. Determining the assumed control risk is not always easy and straightforward. The best estimates usually come from Belgian data, e.g. for cancer the data from the cancer registry are a valuable tool. When not available one can use expert opinion or take the baseline effect from studies in the literature. When different studies exist with varying baseline risk sometimes the median control risk is taken (this is what GRADE pro does by default), but it may be better to report a range of plausible values.
5.5.4. Dealing with fragility: Optimal Information Size (OIS)
The clinical decision threshold criterion is not completely sufficient to deal with issues of precision. The reason is that confidence intervals may appear narrow, but small numbers of events may render the results fragile.
The reasoning above suggests the need for, in addition to CIs, another criterion for adequate precision. GRADE suggests the following: if the total number of patients included in a systematic review is less than the number of patients generated by a conventional sample size calculation for a single adequately powered trial, consider the rating down for imprecision. Authors have referred to this threshold as the “optimal information size” (OIS). Many online calculators for sample size calculation are available, you can find one simple one at http://www.stat.ubc.ca/∼rollin/stats/ssize/b2.html.
As an alternative to calculating the OIS, review and guideline authors can also consult a figure to determine the OIS. The figure presents the required sample size (assuming α of 0.05, and β of 0.2) for RRR of 20%, 25%, and 30% across varying control event rates. For example, if the best estimate of control event rate was 0.2 and one specifies an RRR of 25%, the OIS is approximately 2 000 patients.
The choice of RRR is a matter of judgment. The GRADE handbook suggested using RRRs of 20% to 30% for calculating the OIS, but there may be instances in which compelling prior information would suggest choosing a larger value for the RRR for the OIS calculation.
Beware, however, not to base your sample size on the RRR of minimally clinical importance, a practice that is suitable for sample size calculations when you set up studies, but not for judging fragility, because it leads to paradoxes: if expected effects are considerably larger than what is clinically important because the clinically important effect is small (e.g. a small effect on mortality in children would be considered important), you would risk to downgrade without good reasons because the required sample size would be too large. Note that the OIS helps judging the stability of the CIs, and not if the study was large enough to detect a difference.

Power is, however, more closely related to number of events than to sample size. The figure presents the same relationships using total number of events across all studies in both treatment and control groups instead of total number of patients. Using the same choices as in the prior paragraph (control event rate 0.2 and RRR 25%), one requires approximately 325 events to meet OIS criteria.

Calculating the OIS for continuous variables requires specifying:
- probability of detecting a false effect – type I error (α; usually 0.05)
- probability of detecting a true effect – power (usually 80% [power = 1 – type II error; β; usually 0.20])
- realistic difference in means (Δ)
- appropriate standard deviation (SD) from one of the relevant studies (we suggest the median of the available trials or the rate from a dominating trial, if it exists).
For continuous variables we should downgrade when total population size is less than 400 (a threshold rule-of-thumb value; using the usual α and β, and an effect size of 0.2 SD, representing a small effect). In general an number of events of more then 400 guarantees the stability of a confidence interval.
5.5.5. Low event rates with large sample size: an exception to the need for OIS
In the criteria we have offered so far, our focus has been on relative effects. When event rates are very low, CIs around relative effects may be wide, but if sample sizes are sufficiently large, it is likely that prognostic balance has indeed been achieved, and rating down for imprecision becomes inappropriate. 
The decision regarding the magnitude of effect that would be important is a matter of judgment. When control rates are sufficiently low, CIs around relative effects can appear very wide, but CIs around absolute effects will nevertheless be narrow. Thus, although one would intuitively rate down for imprecision considering only the CI around the relative effect, consideration of the CI around the absolute effect may lead to an appropriate conclusion that precision is adequate. Note that the inference of unimportance requires a low incidence of events over the desirable duration of follow-up; short follow-up will generate a low incidence of events that may be misleading.